Before choosing your transformer or debating hyperparameters, ask: How will you measure if annotations are correct? What's your gold standard? What thresholds are acceptable? How will you catch drift?

Before choosing your transformer or debating hyperparameters, ask: How will you measure if annotations are correct? What's your gold standard? What thresholds are acceptable? How will you catch drift?
What's funny? We spend so much time on model architectures, transformer layers, and attention mechanisms, yet the real determinant of whether your AI will be brilliant or embarrassingly wrong comes down to whether someone correctly drew a box around a cat in an image at 3 PM on a Tuesday.
Welcome to data annotation assessment, where rubber meets the road and the abstraction of "machine learning" collides headfirst with the messy, human reality of labeling data. And if you think this is just about quality control, just like your model in case of poor annotation, you're embarrassingly wrong and missing the deeper story. This is all about building the foundation upon which billion-dollar AI systems either soar or stumble.
The global data annotation tools market wasvalued at USD 1.02 billion in 2023 and is expected to reach USD 5.33 billion by 2030, growing at 26.3% CAGR. That's a market explosion driven by one truth: garbage in, garbage out.
In short, data annotation quality assessment is the continuous process of measuring, validating, and improving how humans transform raw data into machine-readable truth. Without it, AI is leaning to see through a funhouse mirror.
Here are the metrics that separate production-grade from amateur annotation:
IAA measures how often annotators make the same decision. It quantifies consistency among different annotators
Key metrics include:
Cohen's Kappa (κ): For two annotators, it adjusts for chance agreement by coincidence.
Fleiss' Kappa: Extends to three or more annotators
Krippendorff's Alpha: Handles incomplete data and multiple data types
The key difference between high and low IAA is guideline clarity; even expert annotators can't agree on poorly defined categories.
Precision measures correctly annotated instances among all labeled positives. Recall assesses finding all relevant instances. The tension between them defines the annotation strategy.
The F1 score combines precision and recall, providing a harmonic mean valuable for imbalanced datasets.
In short, an F1 score is most useful when class distribution is uneven, like in medical imaging, where disease cases represent only 5% of the data.
Gold standard accuracy measures annotations against verifiably correct reference data. Create curated "golden" examples and periodically test annotators against this benchmark. Annotators with a kappa below 0.8 receive retraining.
Error rate analysis tracks incorrect labels and identifies mistake patterns. Apple's ML team found that using confidence intervals and acceptance sampling can reduce required sample sizes by 50% while maintaining statistical guarantees.
Metric | Measures | Why It’s Critical |
|---|---|---|
IAA (Kappa, Alpha) | Annotator consistency | Detects unclear categories |
Precision | Correct positives | Controls false alarms |
Recall | Captured positives | Controls missed cases |
F1 Score | Precision/Recall balance | Vital for imbalanced data |
Gold Accuracy | Match to verified truth | Anchors objective quality |
Core Quality Metrics
AI-driven annotation tools can reduce manual intervention by up to 40% through predictive labeling. Yet manual annotation holds63.8% market share in 2024 because subtle interpretation remains difficult to automate.
The key difference between automated and manual annotation is understanding when each approach fails. A study analyzing 57,648 annotated masks from 924 annotators found that annotation companies with robust QA consistently outperformed crowdsourcing platforms. iMerit's ANCOR improved annotation accuracyby 38% and doubled output speed by automating repetitive radiology tasks.
Overall, the future is hybrid. Companies like Abaka AI specialize in these hybrid pipelines, where AI handles bulk annotation and human experts validate edge cases.
Autonomous vehicles account for 32.9% of the AI annotation market. Waymo's dataset contains 12 million LiDAR and 9.9 million camera annotations. IMAGINE if 1% are wrong. Consequences aren't academic.
When the target reached 99% accuracyin product-content auditing, it translated directly to higher e-commerce conversion rates. Manual labeling alone causes error rates up to 25% higher than hybrid approaches.
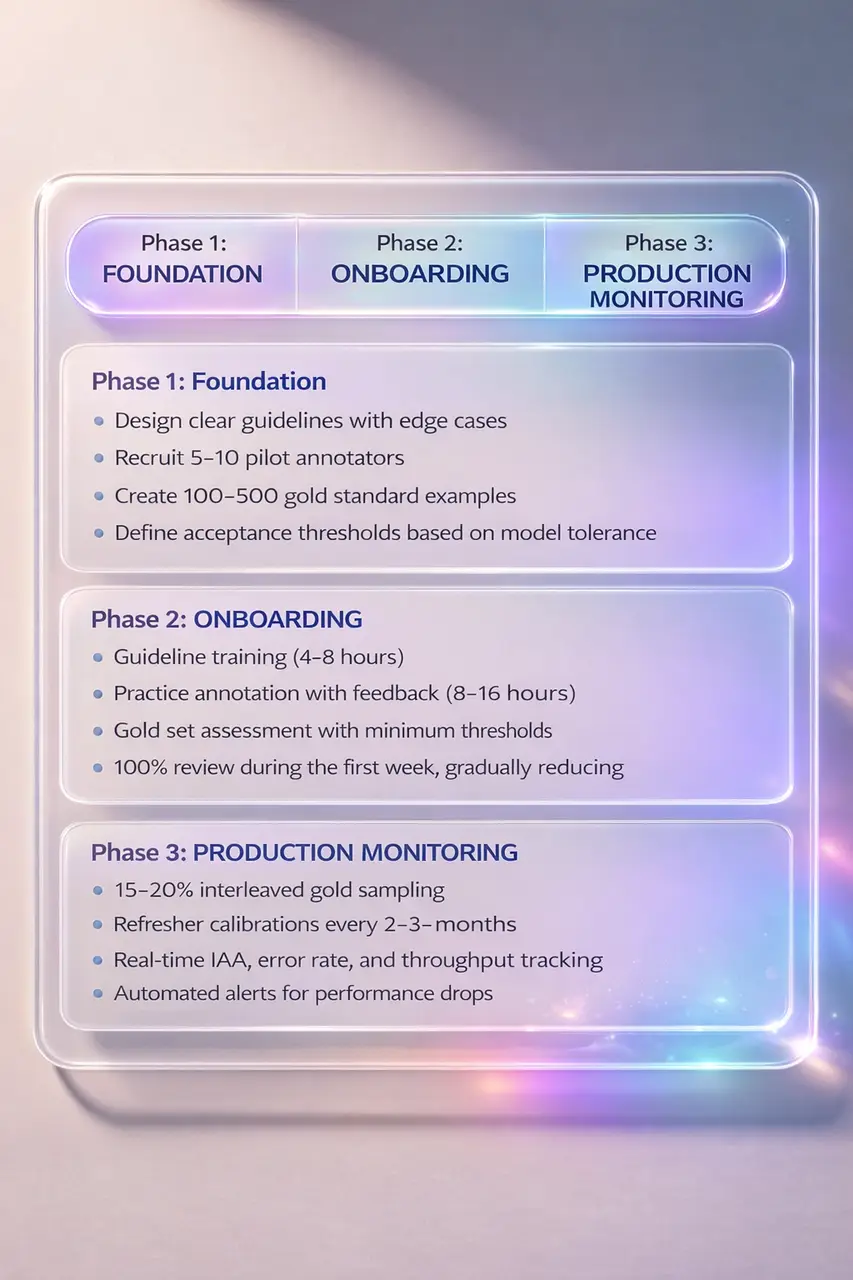
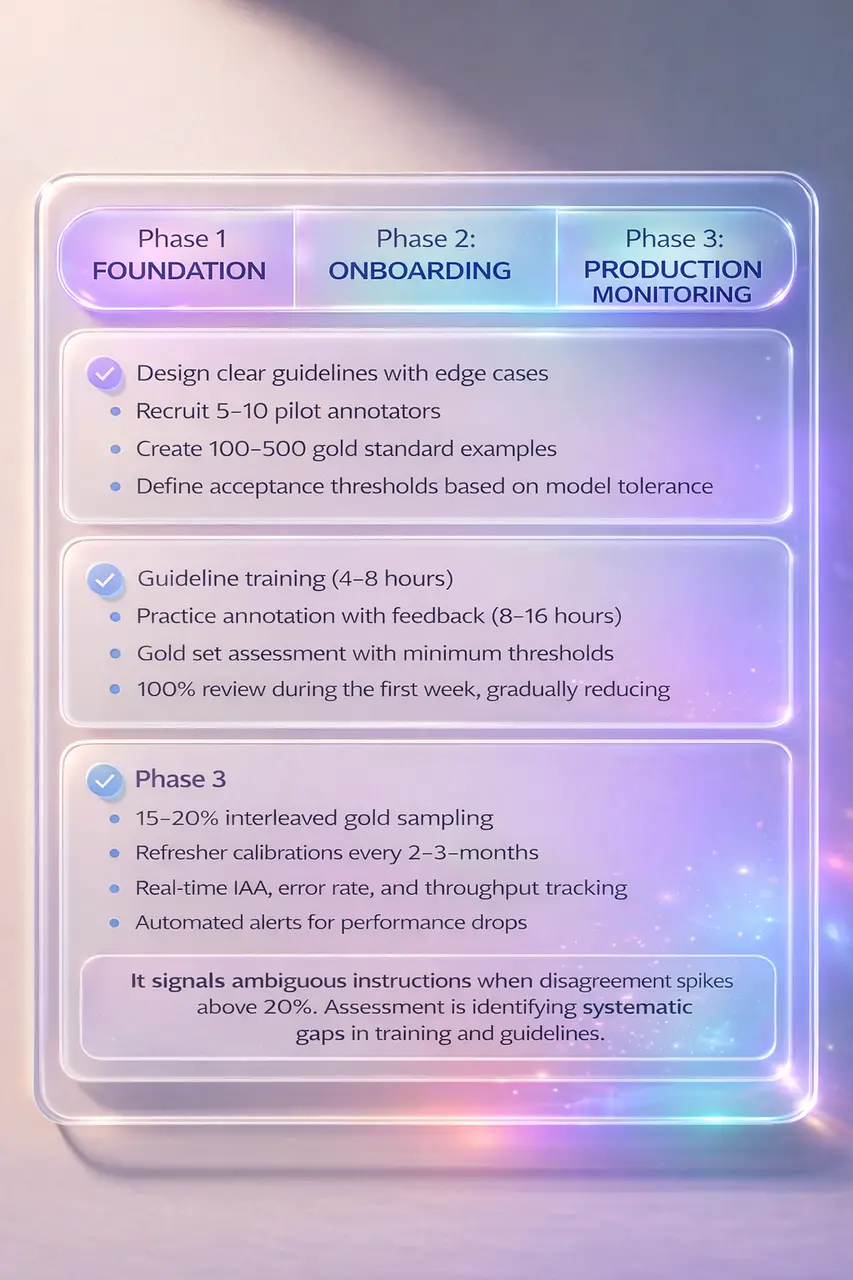
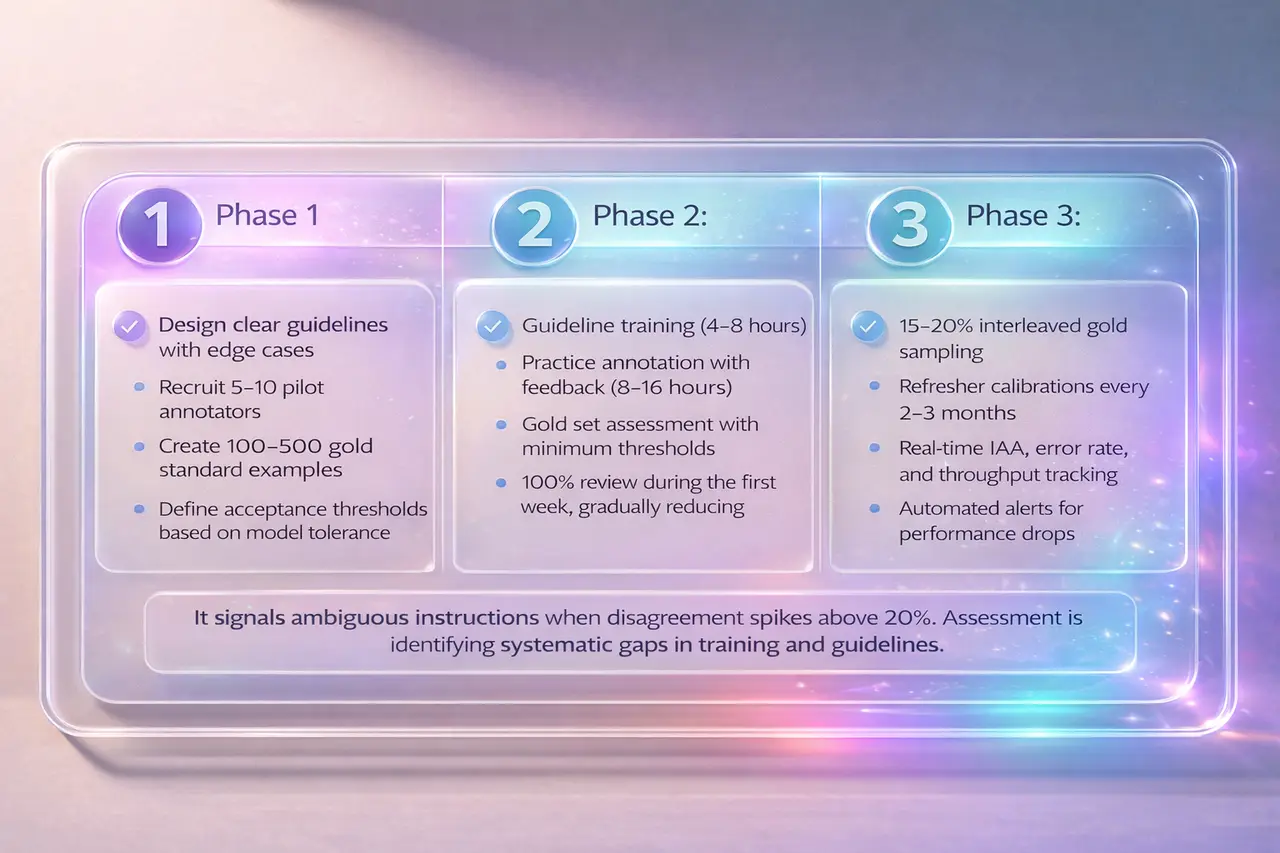
Phase 1: Foundation
Design clear guidelines with edge cases
Recruit 5-10 pilot annotators
Create 100-500 gold standard examples
Define acceptance thresholds based on model tolerance
Phase 2: Onboarding
Guideline training (4-8 hours)
Practice annotation with feedback (8-16 hours)
Gold set assessment with minimum thresholds
100% review during the first week, gradually reducing
Phase 3: Production Monitoring
15-20% interleaved gold sampling
Refresher calibrations every 2-3 months
Real-time IAA, error rate, and throughput tracking
Automated alerts for performance drops
It signals ambiguous instructions when disagreement spikes above 20%. Assessment is identifying systematic gaps in training and guidelines.
Abaka AI embeds continuous assessment throughout annotation lifecycles:
Domain-Specific Expertise: Pipelines built by teams with deep domain knowledge in medical imaging, autonomous systems, NLP, etc.
Annotation Projects Accuracy: consistently achieve over 95% accuracy, with many reaching 99%+ through multi-layer quality checks, expert review, and client-specific validation metrics.
Hybrid Quality Frameworks: AI-assisted pre-annotation with human validation uses active learning to identify ambiguous cases
Real-Time Quality Dashboards: Live visibility into IAA scores, error rates, and annotator performance
RLHF and Model Evaluation: Supports Reinforcement Learning with Human Feedback workflows that create feedback loops between annotation and model performance
Scalable Pipelines: Quality assurance scales from 1,000 to 1 million annotations without degradation
Quick Turnaround: Deliver results in as fast as 12 to 24 hours for urgent projects, while maintaining high accuracy and quality.
Learn more 👉 Data Annotation Q&A
Fast, cost-effective annotation means nothing if quality isn't there. Abaka AI's assessment-first approach ensures speed and accuracy are complementary. Contact us to make your model a new genius.
The trajectory: increasingly automated but never fully autonomous. The most effective systems use AI to scale quality measurement while keeping human experts in the loop.
Assessment is a strategy. The key difference between projects that succeed and those that stall is nothing other than quality process rigor.
Before choosing your transformer or debating hyperparameters, ask: How will you measure if annotations are correct? What's your gold standard? What thresholds are acceptable? How will you catch drift?
Your AI is only as smart as the data it learns from, and data quality is only as reliable as your ability to assess it.
What’s the most important metric for annotation quality?
There is no one specific metric. But the Inter-Annotator Agreement (IAA) is the most foundational; it shows whether humans can interpret the task consistently. If annotators disagree, models inherit that noise. In production, track IAA (Cohen’s or Fleiss’ Kappa), gold-set accuracy, and task-specific metrics like precision, recall, or F1.
How often should quality be assessed?
Continuously. Start with a 100% review during onboarding, then shift to 15–20% sampled checks once performance stabilizes. Run calibration every 2–3 months and monitor dashboards daily. Quality is an ongoing control system.
Automated vs manual annotation, which is better?
Each has strengths. Manual excels in subjective or nuanced tasks. Automated labeling reduces manual repetitive effort and scales pattern-based work efficiently. Hybrid systems combine both and can lower error rates by up to ~25% compared to manual-only workflows.
What sample size ensures reliable quality checks?
It depends on confidence level and error tolerance. Statistically grounded sampling (e.g., confidence intervals) can reduce sample size while preserving guarantees. Justify sample sizes based on required precision.
How does poor annotation quality affect models?
It set in stone, a hard ceiling on performance. Systematic labeling errors degrade reliability, safety, and business outcomes. In high-stakes domains like autonomous driving, even small error rates can have serious consequences. Annotation quality directly impacts model trustworthiness and revenue.
What are the challenges of data annotation?
Ambiguity in task definitions, edge cases, domain expertise gaps, annotator drift over time, and scale management. Since datasets grow, maintaining consistency across annotators, languages, and modalities becomes increasingly complex. Clear guidelines, calibration cycles, and QA layers are essential.
What does the evaluation part of annotation assess?
Evaluation measures consistency, accuracy, and guideline adherence. It checks whether labels match ground truth, whether annotators interpret instructions uniformly, and whether edge cases are handled correctly. In practice, this includes IAA scoring, gold-set validation, error categorization, and feedback loops to refine both instructions and workforce performance.
👉 How Much Time Does Data Annotation Assessment Take?— Review cycles and workload
👉 Top Annotation Tools in 2025 — Compare leading platforms and capabilities
👉 Is Your Data Annotation Contact Information Truly Secure? — Protect sensitive data pipelines
👉 AI-Powered Data Annotation Technologies Efficiency Accuracy — Scale labeling without losing quality
👉 What is Data Annotation?— Core concepts explained
👉 How AI-Assisted Video Annotation Cuts Machine Learning Data Costs — Reduce cost per frame intelligently
👉 2025 Top Video Annotation Tools for Autonomous Vehicles — Tools pipelines
👉 Best Annotation Platforms for Embodied AI & Robotics: 3D, LiDAR, and Multimodal Data in 2026 — Evaluate tools for complex sensor data
Apple Machine Learning Research
Quality Assured: Rethinking Annotation Strategies in Imaging AI
Missing data
We collect it.
Messy data
We label it.
No time
We have itOff-The-Shelf.
Pick the closest fit, we'll take the call from there.
Missing data
We collect it.
Messy data
We label it.
No time
We have it Off-The-Shelf.
Pick the closest fit, we'll take the call from there.